Online data management & Data Visualization
Your advantages- • Availability - Your data is where you are
Imagine you have a brilliant idea and would like to immediately refer to your measurement data. Unfortunately, these data are not completely available on your computer.
As we all know, that's actually a problem of yesterday.
Whether you’re working on your PC, tablet or smartphone, our online data service allows you to access all of your measurement data, anywhere.With our online data management tool, you can always comfortably work with the latest data at your workplace in the office, in your home office, out and about, or simply wherever you think up your brightest ideas
- • Efficiency - more time and money for your actual work
It happens that you need to prepare for an important upcoming presentation during which you want to display your latest measurement results. But instead of working on your presentation, unfortunately, you have to beat one of your remote measuring stations collecting data and to make matters even worse, you also find browsing damage on some of your sensors, but do not have the necessary repair tools on hand.
We are all familiar with this type of situation, although such things could be avoided easily.
With our advanced online data service, you can keep an eye on everything and use automated alarm functions via e-mail or SMS to quickly generate seamless data sets.
- • Automation - your computer should do what it does b est , quickly and without careless mistake
Would you like to feed your current measurement data into your modelling or evaluation software via a direct, automated database query? Unfortunately, you have to first manually load all data files downloaded from your measuring stations into the database.
Nowadays it would be convenient to automatedly load data from measuring stations into a common, up-to-date database with direct access.
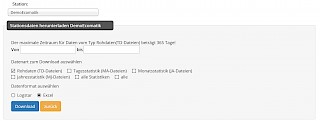
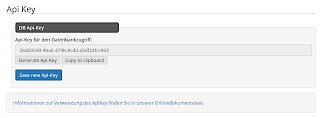
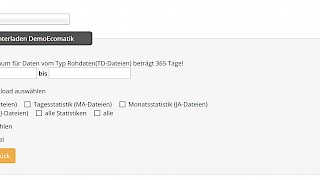
Our online data service offers you an application interface (API-Link) for direct JSON database query on the data server and thus enables fully automated data renewal processing in your system. Aquery of the database and export of the measured values, e.g. in Excel format, are of course possible at any time via the browser interface
- • Visibility - A data graphic is worth a thousand values.
Would you like to rapidly view and compare certain measurement data from your extensive records but find searching for the relevant data section stedious and complicated?
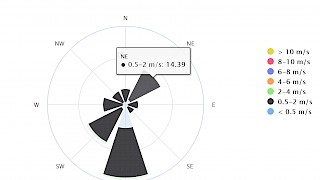
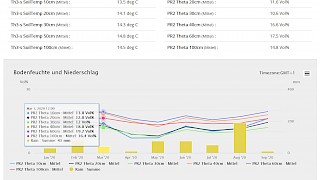
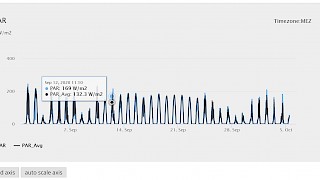
Well, modern interactive graphics with a selectable measuring period and scaling are simultaneously clear and detailed.
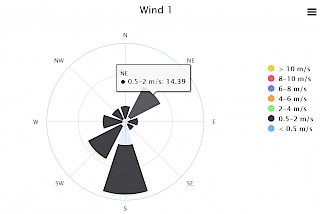
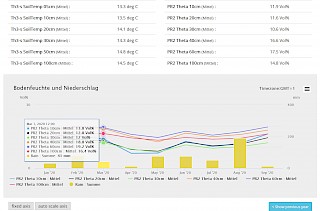
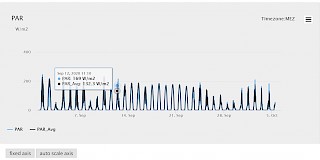
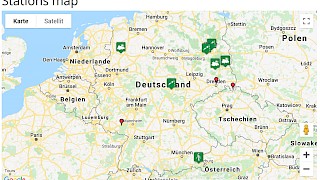
Our visualizations can be adapted to your liking. In this way, you can easily compare various detailed measurement series or data from different measuring stations and present them straightforwardly, for instance to an interested colleague at a conference. You can also easily make your measurement data available online at any time to share it open access with a wide audience. Our Talking Tree is a good example of such a public online data visualization
- • Shareability - Everyone gets what he or she needs: user - account - controlled and task - specific
Imagine you are searching for a simple, secure and sustainable solution to share measurement data and informative data graphics to your working group or with external colleagues. Unfortunately, in your dynamic team composition, access rights and responsibilities are not uniformly clarified at all times. Different versions of a record may also be in circulation. In a worst-case scenario, these records may even become completely lost.
One thing is clear, teams in today’s work environment are no longer static, neither in their composition nor geographical distribution.
Taking this modern work situation into account, our online data service supports your needs with individually customizable access and rights management. Access to measurement data, graphics, as well as rights to upload further processed data into the database can be controlled by user-accounts and be distributed based on specific tasks.
You want your measurement data to be made open source? You can easily make your measurement data available online at any time to share it open access with a wide audience. Our Talking Tree is a good example of such a public online data visualization. The interactive and automatically updated graphics or tables can also be integrated into your own website using iframe - • Security – Better safe than sorry. With us you don't have to worry about data loss anymore.
Together with your colleagues you work on several continuously growing long-term projects. Secure data storage and access to the data for years is therefore essential for you and your team? Over the years, however, your own affiliation and that of your project partners changed. Nevertheless, you all still need access to the collected project data, independent of your current institution or company.
With us, data loss, cumbersome measures to maintain network security guidelines, or inflexible rights management with different and changing memberships in a project team are a thing of the past ...
As long as you host your project data with us, it will be stored securely. A multi-level data backup takes place on two spatially separated data servers. Automated daily, weekly and monthly incremental backups offer additional security. You determine who and to what extent the person has access to the data. In our database, raw data are clearly separated from further calculated secondary data and remain secure and untouched at all times.
- • Customizability – Special requirements, special solutions.
Recording and displaying raw data is not bad, but for a really meaningful and impressive display your raw data requires complex processing, or a special form of visualization or illustration? Simple solutions, inflexible in data processing and visualization are therefore no match for you.
How good that you ended up here with us! Depending on your requirements, we also program and not just configure.
Depending on the respective application, complex data processing can either be implemented directly on the measurement hardware or be carried out post-hoc on our data server. In addition to the standard plots, we can also create customer-specific illustrations and visualizations for an impressive graphical representation of your data.
General information on order processing
Thank you for your interest in our products and services! Here you will find important information about the ordering process:
To our international customers: Please note, we ship worldwide! If we do not currently have a listed distributor in your country (a list can be found here) , please feel free to contact us directly.
Assessment of your needs
With your consideration and input, we determine which of our products best meet your needs. We are also happy to design fully-integrated measuring stations (plant, climate, soil sensors), including an independent power supply and mobile data transmission, depending on your requirements.
Do you require our assistance before placing an order?
We are happy to help! So that we can provide you with correct and helpful advice, please fill out the online form below with your contact details and other information about your application and send it our way. We will then immediately review your details and contact you.
Are you already familiar with our products and know exactly what you need?
Perfect, then just write us an email! In your order, please state the diameter of your measuring objects in addition to the required cable lengths.
Your contact details and Assessment of your needs
Like so many things, everything started with an idea ...
In the case of the plant scientist and founder of ECOMATIK, Dr. Liu, it was the idea that modern measurement technology should enable crucial plant physiological parameters to be measured directly, precisely and with high temporal resolution on the plant itself. It was obvious to him that there is an information potential of immense value in the detailed understanding of immediate reactions of plants to their environment...
